Groundwater and Surface Water Interactions……

Groundwater and Surface Water Interactions……

Abstract

Groundwater and surface water interaction is an essential component of the hydrological cycle. The hydraulic connectivity and exchange of water between surface water (e.g. rivers, lakes, wetlands) and underlying aquifers provide many ecosystem services that sustain human and ecological well-being. Climate change, increased population, and industrial growth have resulted in substantial environmental (e.g. land use and land cover, climate, groundwater) changes across the globe. As a result, decline in groundwater levels, drying of streams, shrinking lakes, wetlands, and estuaries have been observed across the world. This generates concerns about the effects of such environmental changes on groundwater and surface water interactions, and on the quality and quantity of water resources. This chapter presents an overview of groundwater and surface water interactions, pressing environmental change issues centered on natural and anthropogenic environmental changes, and available management tools that quantify the integrated groundwater and surface water flow processes. This chapter also briefly discusses exciting research opportunities enabled by satellite remote sensing. We close in with a discussion of future management challenges and strategies for sustainable use of groundwater and surface water resources. One outcome of this chapter is to provide resource managers, researchers, consultant groups, and government agencies basic understanding of the types, mechanism, and effects of natural and anthropogenic landuse changes on groundwater and surface water interactions, and available management tools for studying groundwater and surface water interactions.

Link for full length paper:

http://link.springer.com/chapter/10.1007/978-3-319-32008-3_11

Testing the recent snow drought as an analog for climate warming……

Testing the recent snow drought as an analog for climate warming……

Abstract

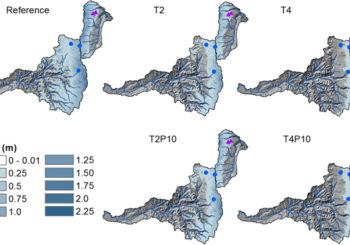
Record low snowpack conditions were observed at Snow Telemetry stations in the Cascades Mountains, USA during the winters of 2014 and 2015. We tested the hypothesis that these winters are analogs for the temperature sensitivity of Cascades snowpacks. In the Oregon Cascades, the 2014 and 2015 winter air temperature anomalies were approximately +2 °C and +4 °C above the climatological mean. We used a spatially distributed snowpack energy balance model to simulate the sensitivity of multiple snowpack metrics to a +2 °C and +4 °C warming and compared our modeled sensitivities to observed values during 2014 and 2015. We found that for each +1 °C warming, modeled basin-mean peak snow water equivalent (SWE) declined by 22%–30%, the date of peak SWE (DPS) advanced by 13 days, the duration of snow cover (DSC) shortened by 31–34 days, and the snow disappearance date (SDD) advanced by 22–25 days. Our hypothesis was not borne out by the observations except in the case of peak SWE; other snow metrics did not resemble predicted values based on modeled sensitivities and thus are not effective analogs of future temperature sensitivities. Rather than just temperature, it appears that the magnitude and phasing of winter precipitation events, such as large, late spring snowfall, controlled the DPS, SDD, and DSC.

Link for full length paper:

http://iopscience.iop.org/article/10.1088/1748-9326/11/8/084009/meta

Characterizing Runoff and Water Yield…………

Characterizing Runoff and Water Yield…………

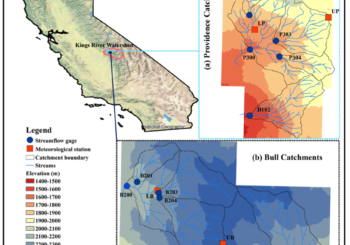
ABSTRACT: In a Mediterranean climate where much of the precipitation falls during winter, snowpacks serve as the primary source of dry season runoff. Increased warming has led to significant changes in hydrology of the western United States. An important question in this context is how to best manage forested catchments for water and other ecosystem services? Answering this basic question requires detailed understanding of hydrologic functioning of these catchments. Here, we depict the differences in hydrologic response of 10 catchments. Size of the study catchments ranges from 50 to 475 ha, and they span between 1,782 and 2,373 m elevation in the rain-snow transitional zone. Mean annual streamflow ranged from 281 to 408 mm in the low elevation Providence and 436 to 656 mm in the high elevation Bull catchments, resulting in a 49 mm streamflow increase per 100 m (R2 = 0.79) elevation gain, despite similar precipitation across the 10 catchments. Although high elevation Bull catchments received significantly more precipitation as snow and thus experienced a delayed melt, this increase in streamflow with elevation was mainly due to a reduction in evapotranspiration (ET) with elevation (45 mm/100 m, R2 = 0.65). The reduction in ET was attributed to decline in vegetation density, growing season, and atmospheric demand with increasing elevation. These findings suggest changes in streamflow in response to climate warming may likely depend on how vegetation responds to those changes in climate.

Link for full length paper:

https://www.fs.fed.us/psw/publications/hunsaker/psw_2016_hunsaker004_safeeq.pdf

Linking Hydroclimate to Fish Phenology……

Linking Hydroclimate to Fish Phenology……

Abstract

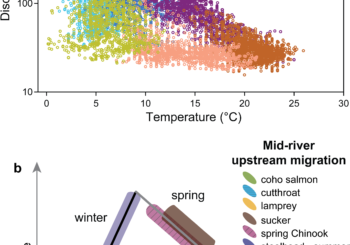
Streamflow and water temperature (hydroclimate) influence the life histories of aquatic biota. The relationship between streamflow and temperature varies with climate, hydrogeomorphic setting, and season. Life histories of native fishes reflect, in part, their adaptation to regional hydroclimate (flow and water temperature), local habitats, and natural disturbance regimes, all of which may be affected by water management. Alterations to natural hydroclimates, such as those caused by river regulation or climate change, can modify the suitability and variety of in-stream habitat for fishes throughout the year. Here, we present the ichthyograph, a new empirically-based graphical tool to help visualize relationships between hydroclimate and fish phenology. Generally, this graphical tool can be used to display a variety of phenotypic traits. We used long-term data sets of daily fish passage to examine linkages between hydroclimate and the expression of life-history phenology by native fishes. The ichthyograph may be used to characterize the environmental phenology for fishes across multiple spatio-temporal domains. We illustrate the ichthyograph in two applications to visualize: 1) river use for the community of fishes at a specific location; and 2) stream conditions at multiple locations within the river network for one species at different life-history stages. The novel, yet simple, ichthyograph offers a flexible framework to enable transformations in thinking regarding relationships between hydroclimate and aquatic species across space and time. The potential broad application of this innovative tool promotes synergism between assessments of physical characteristics and the biological needs of aquatic species.

Link for full length paper:

http://journals.plos.org/plosone/article?id=10.1371/journal.pone.0168831